
Section 12. Thematic reviews
12.5. Review of Hydropower Capacity Additions in 2021
Prepared by Eugene Simonov, the Rivers without Boundaries Coalition
Hydropower built in 2021: Its role in energy revolution continues to decline, but damage to river ecosystems persists

Hydro - no longer the engine for energy transition
In April IRENA issued new Renewable Capacity Statistics: Hydropower net additions (without pumped storage) are preliminarily assessed in 2021 as 18.9 GW, which is only 7% of global growth in renewables estimated as 257 GW (roughly the same additions as in 2022). Hydropower has shown the slowest growth (2%) among all types of renewables (9% on average).
In June the IHA followed with the State of Hydropower Report for 2021 which reveals that 26445 MW were added in 2021, from which 4700MW in pumped storage.

Finally, Ren21 thinktank also issued its regular report :”Renewables 2022 Global Status Report”, which has the most informative chapter on hydropower. It estimates expansion of hydropower in 2021 at 26GW and expansion of Pumped storage at 3 GW.
The International Energy Agency recently predicted that in the “main case” (without policy-driven acceleration) hydropower capacity addition will be highest in 2021-2022 (during the period before 2026) and will constitute 33 GW. If we add to 19 GW of conventional hydro the 4.7GW of pumped-storage hydro (PSH) installed in 2021 then overall addition will be still only 24 GW – one quarter or 9 GW short of the IEA forecast. If we opt to use 26.4 GW reported by the IHA or Ren21, this gap will be 6.6 GW.

Data from all agencies again vividly show that significance of hydropower for energy transition continues to decline, despite hectic efforts of industrial lobby to promote its “decisive role in fighting climate change”. This is fully in line with IPCC report on mitigation issued in April 2022, which listed hydropower as having the least potential to reduce GHG emissions among all measures in energy industry in the period before 2030, when urgent action is needed.
Bad climate for hydro
According to Ren21 Report, despite growth in capacity, “global generation from hydropower fell an estimated 3.5% in 2021 to around 4,218 terawatt-hours (TWh). This reflected changes in hydrological conditions, specifically the significant and sustained droughts that have affected major hydropower producers in the Americas and in many parts of Asia. Loss of glacial icecaps, such as in the Himalayas, is causing long-term change in output in affected areas. The large producers experiencing the greatest decline in generation in 2021 were Turkey (-28.7%), Brazil (-9.1%) and the United States (-8.8%). Other major markets with more modest contractions (although in some cases larger multi-year declines) included India (-2.2%), Canada (-1.5%) and China (-1.1%). The IHA Report also referred to similar trend in several regions”. In 2021-2022, Norway undergoes the climate-related crisis in generation and is forced to reduce power supplies to EU.
Increase of river flow may be as dangerous as decrease. Ren21 reminds that “India’s hydroelectricity generation fell slightly during 2021 (-2.2%) to 168.4 TWh, the overall trend in recent years has been a large increase in output, driven mainly by the melting of glacial icecaps. In the five years since 2016, hydropower generation rose 31% while installed capacity increased only 9.2%.Glacial melting in the Himalayas contributes to increased river flow, as the mountain range has lost an estimated half meter of ice (8 billion tons of water) on average per year over the last two decades. In early 2021, the Rishi Ganga River in Uttarakhand swelled more than 15 metres in an avalanche-induced flash flood of glacial meltwater. In additions to the many lives lost, the torrent destroyed the 13.2 MW Rishi Ganga plant and damaged the 520 MW Tapovan-Vishnugad plant under construction”.
Despite prices of all renewables continue to decline, except for hydropower
Another IRENA Report “Renewable Power Generation Costs in 2021” shows that the newly commissioned hydropower projects have lost their major competitive advantage, that is the cost of generated hydropower virtually all over the world.
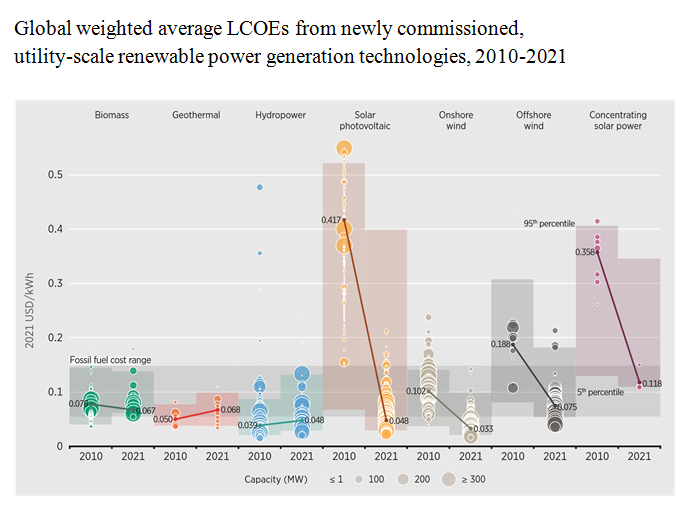
The above Figure shows that in the last decade the cost of solar and wind generation (one kilowatt hour) fell by 60-80%. The cost of one kilowatt hour of energy produced by newly commissioned hydropower projects increased by 24% and became equal for solar. Certainly, this is the case for new hydropower projects as the earlier commissioned ones, with already repaid construction, have lower cost of generation but growing cost of modernization.
Economically, this means that hydropower projects do not offer anymore the cost-efficient production of energy demanded. In other words, it is advisable to use maneuvering capacities of existing hydropower projects to balance variable daily generation of newly commissioned solar and wind project instead of building new hydropower.
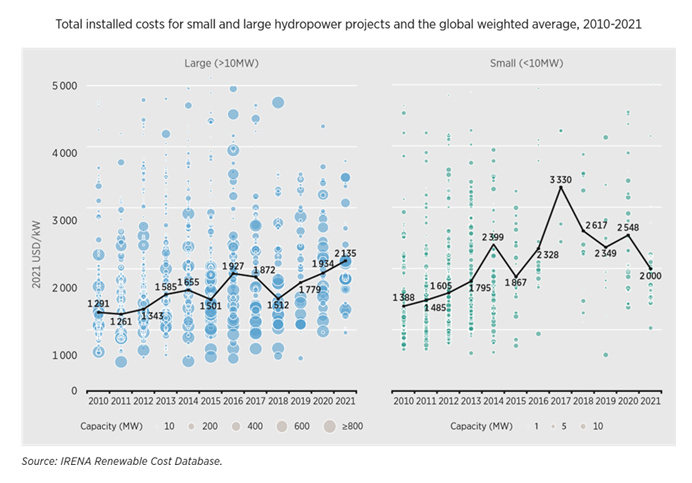
Construction of new hydropower projects becomes challenging for a number of reasons: long lead and construction time, frequent and significant cost overrun, high cost of individual projects, and continually rising cost for adding unit hydropower capacity to new projects.
In a decade, the installed costs for hydropower rose by 64%, whereas for solar and power generation those decline rapidly. The cost of one kilowatt of energy produced is on average $2135 for hydropower, $1327 for onshore wind, and $857 for solar PV.
Interestingly, lower costs in the past years were determined by lower-than-average installed costs in China, which added, at least, the half of capacities in the world. The higher was the share in China, the cheaper the cost of one kilowatt of energy seemed. In 2021, for the first time China acknowledged that hydropower is very expensive to build.
Actual picture more worrying than it seems
According to IRENA, 46 countries added some hydropower capacity in 2021, while in 9 countries capacity decreased (similar numbers observed in 2020 ).The IHA believes that only 38 countries added some capacity. Closer look at IRENA’s statistics shows that actual newly installed conventional hydropower (at country level) accounted for 23 GW (very close to IHA figures), while reported decline in capacity have been almost 4.5 GW, most of it in USA and EU. This mysterious decline is 10 times more than country-level reductions in capacity reported in 2020. This means that despite declining “net additions”, in 2021 we see at least 1.6-3 GW more of new conventional hydro put online than in 2020. Of course, we do not know what part of new capacity comes from modernization of old existing dams, but it normally under 10% and list of countries with new additions makes us think that share is even lower. This, likely, there was year to year increase in new rivers destroyed for hydropower.

Pumped storage hydropower (PSH)
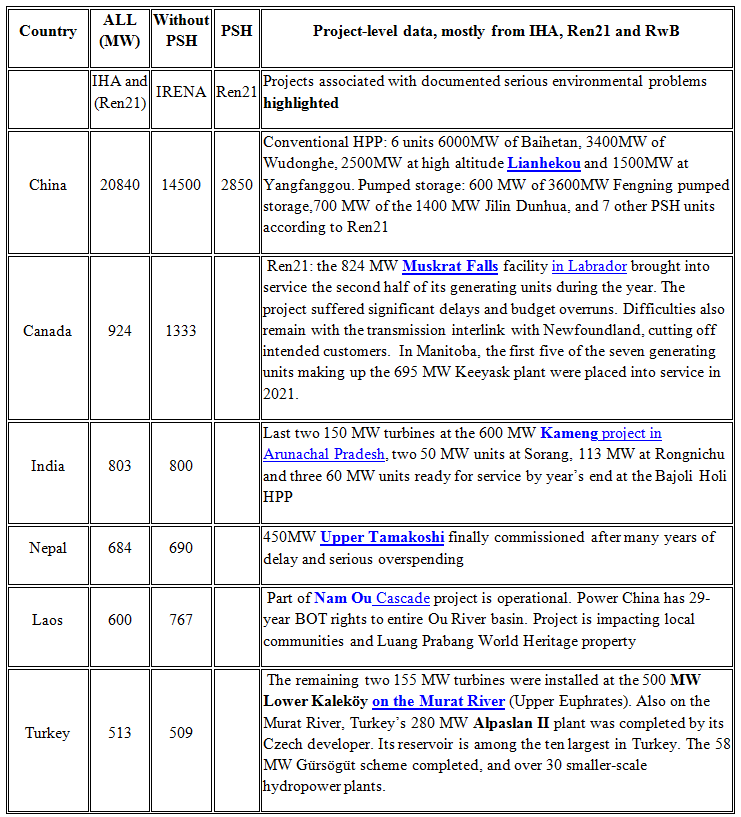
PSH is considered a promising way to store energy and regulate energy systems, but its development recently experienced serious setbacks. China has upgraded its policies to incentivize PSH. According to IRENA, in 2021 China commissioned 6 GW of pumped storage, which brings overall pumped storage capacity in China to 36GW. According to the IHA, China added 4.5 GW, but any project-level evidence is presented only for 1300MW (600 MW at Fengning pumped storage 600 and 700 MW at MW Jilin Dunhua PSHPP). Ren 21 documented 2850MW of new PSH in nine different projects.
Ukraine, who comes next, installed 324 MW of pumped storage. The United States expanded one PSH by 70MW
Globally net PSH addition in 2021 was 5992 MW according to IRENA and 4700 MW according to the IHA and we cannot find proof to either of these figures at project level.
An average PSH is less destructive for river ecosystems and sometimes can be built without damming any natural streams (closed-loop design). However, built at wrong place (like Kanev PSH in Ukraine or Snowy-II in Australia) a pumped storage facility may incur as much negative impact as two conventional hydropower plants. All in all, slowing down of convention hydro development partly depends on incentives created for acquiring costly but reliable PSH technology, which is better suited for regulating energy systems.
The role of China
According to IRENA, China alone installed domestically 14.5 GW, mostly by completing several megadams in Yangtze Basin, which makes up 80% of net additions in 2021. This includes completion of the first high-altitude dam in Tibetan Plateau - Lianghekou, where it flooded Jinsha river valley - essential refugia both for biodiversity and indigenous people.
According to IHA, “China continues to lead the way on new development, contributing 16300 MW of the new capacity that came online in 2021 (besides, Pumped storage hydropower totaled 4.5 GW of the new additions in capacity, up on the 1.5 GW added in 2020).”
According to Ren21, “While China’s net hydropower capacity grew around 5.6%, generation fell 1.1% to 1,340 TWh in 2021. Hydropower’s relative contribution to the country’s energy mix has declined in recent years as other generating technologies have gained market share and as capacity utilization has decreased (due likely to changing weather patterns). During the (13th five-year plan) period 2016-2021, China’s overall electricity generation rose more than 36%, while hydropower output grew only around 12% (with capacity growth of 16%), causing hydropower’s share of supply to drop from 19.4% to 16%.”
In the rest of the world approximately 6 GW of hydropower was installed in 2021 and no country besides China installed more than 1 GW. Much of those additions came with China’s financing and/or hydroengineering contracts.
In our preliminary estimate Chinese companies in 2021 participated in installing at least 2200 MW in other countries of the world. This brings participation of Chinese companies up to 90% of net hydropower capacity installed globally in 2021.
What other countries installed hydropower in 2021?

Canada, Nepal, Lao PDR, Norway, Zambia, are countries with most of their generation coming from hydro, thus new hydropower does not improve or diversify their energy systems. Nearly half of countries which added more than 10 MW are those with more than 50% of their electricity already supplied by hydro, which makes them potentially vulnerable to climate change.
According to the IHA and Ren21 reports, globally installed hydropower in 2021 included at least 11 pumped storage units, completion of units in approximately 25 conventional dam-based large greenfield hydropower projects, more than 80 small hydropower stations (<10MW). Reports named only 6 projects of expansion through modernization of existing facilities, but this is due to less attention paid to this crucial activity by industry and governments. Accuracy of national reporting to IRENA differs from country to country and we rely on IHA/Ren21 data in case of discrepancy. We also found no explanation for exceptionally high figures of decrease in capacity in the United States (3.8 GW) reported by IRENA. Table below covers only capacity additions > 10 MW.


Sources: data.worldbank.org/indicator/, www.transrivers.org/2022/3663/, www.transrivers.org/2022/3695/